

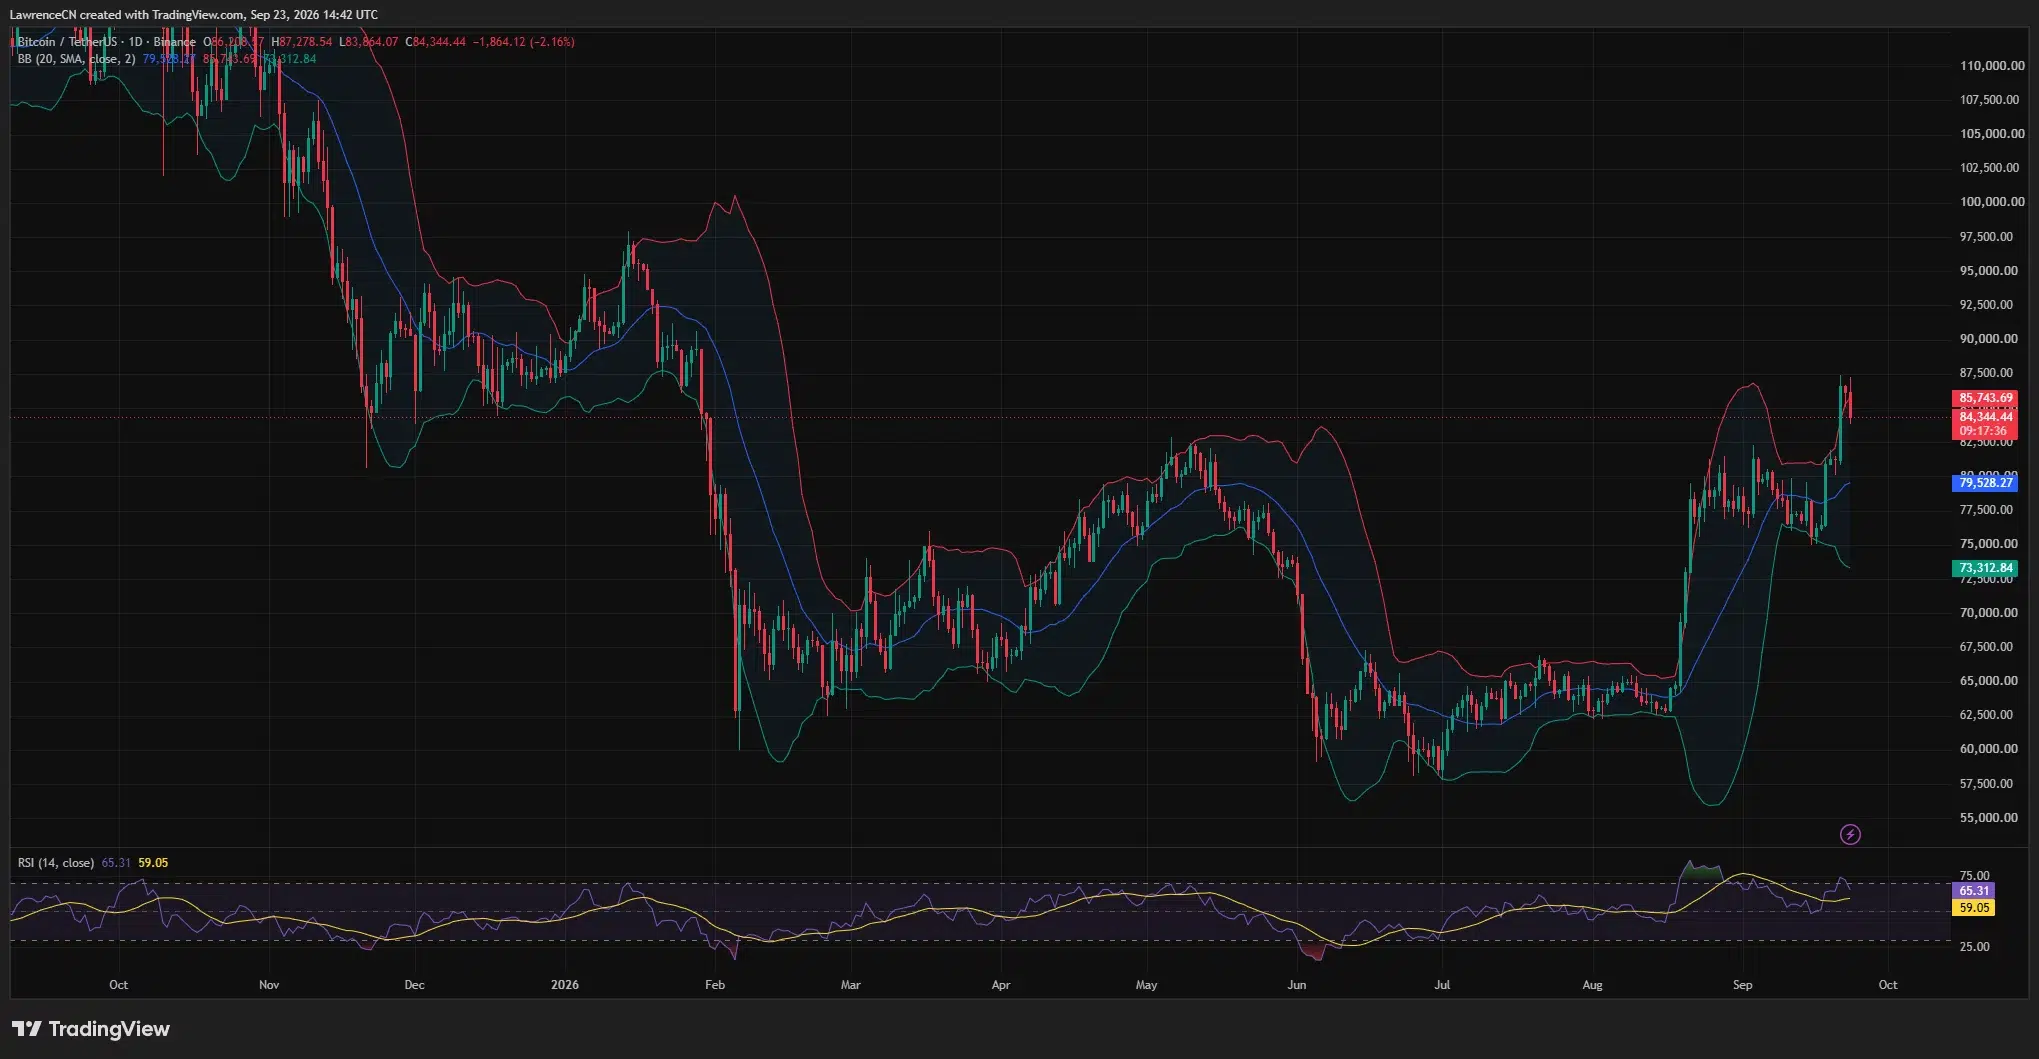
On September 23, Bitcoin’s value fell beneath $85,000 after briefly exceeding $87,000, as the short liquidation-driven rally began to lose momentum. The daily chart showed BTC around $84,344, representing a 2.16% decline for the day.
Summary
- Bitcoin’s price declined from a daily high of approximately $87,279 to about $84,344, as per the daily chart.
- The daily RSI was noted at 65.31, with the 4-hour Supertrend support established near $83,593.
- Alice Liu from CoinMarketCap mentioned that the rally was driven by forced short covering rather than new buying initiatives.
- According to Farside Investors, US spot Bitcoin ETFs garnered $999 million in investments on September 21.
Bitcoin price pulls back after nearing $87K
The daily chart indicates that Bitcoin (BTC) achieved a peak price of $87,278.54 before retreating to around $84,344. This drop took the price below the upper Bollinger Band of $85,743.69 on the chart, following a sharp rise from mid-September lows near $75,000.
On the 4-hour chart, the recent decline is even clearer. The current candle dipped from an opening near $85,650 down to about $84,329, reaching a low of around $83,864. The price stayed above the 4-hour Supertrend line at $83,592.86, although the recent downturn has brought this level into consideration once more.
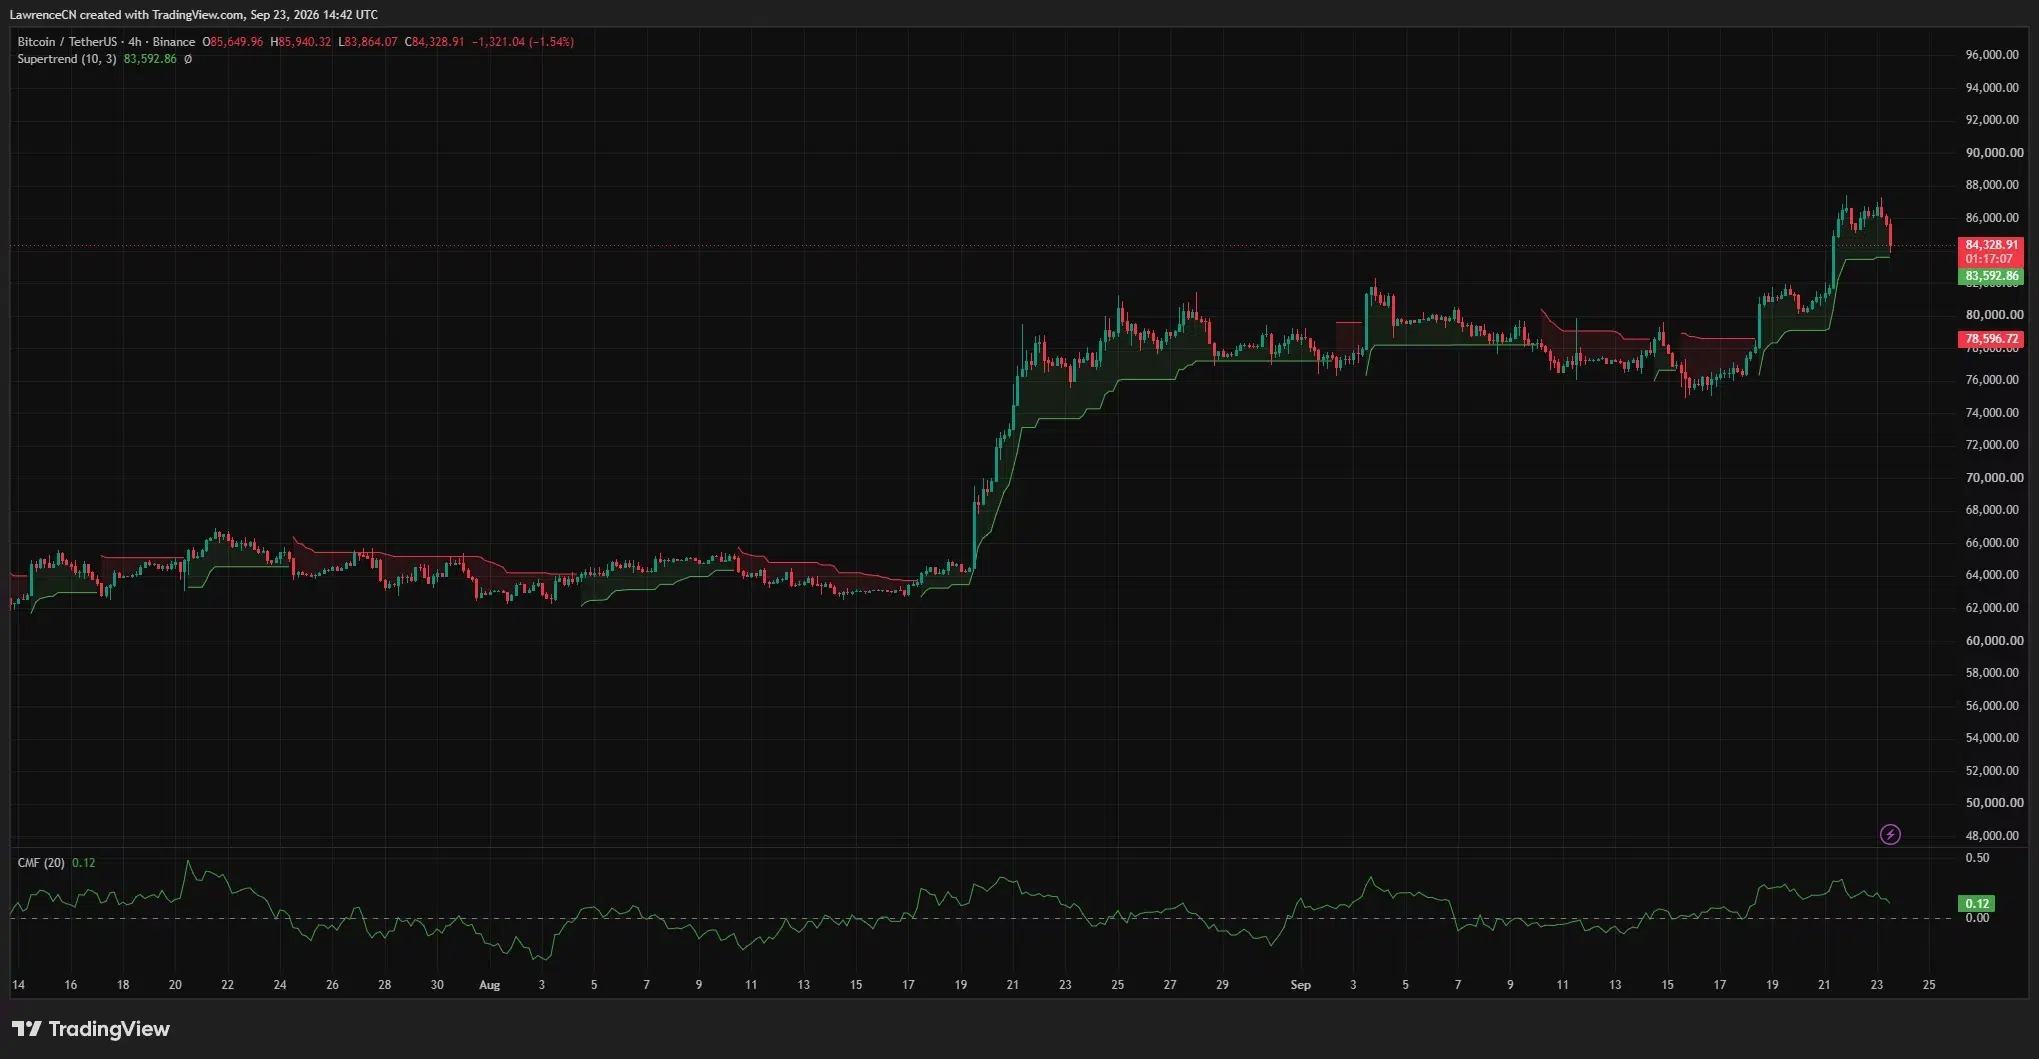
The daily relative strength index (RSI) for Bitcoin was at 65.31. An RSI higher than 50 indicates that recent gains outweigh losses; however, this metric has fallen from its peak near 70 during the rally’s crest. Meanwhile, the 4-hour Chaikin Money Flow indicator remained positive at 0.12, suggesting that buying momentum has not entirely faded as the price receded.
Consequently, the charts point to a temporary pause in the substantial price advance, turning the immediate focus to whether buyers can sustain the levels reached this week instead of pushing for further breakout.
Short covering drove the price surge
Alice Liu, research lead at CoinMarketCap, remarked that the climb towards $87,000 was primarily attributed to the closure of bearish positions by traders. She reported that forced short covering on Monday was around ten times the amount of long liquidations, with overall liquidations dropping to half their 30-day average by Tuesday.
“Bitcoin’s rise to $87,000 was fueled by the unwinding of bearish positions, not by fresh buying. The momentum is behind us, not in front.”
Liu’s observation raises an essential query for the next stage of price movements: can spot buyers maintain the current prices once the impulsive purchases associated with short position closures come to an end? A chart from CryptoQuant shows a rise in futures demand, while spot demand remains negative. This discrepancy indicates increased activity in derivatives compared to confirmed spot buying; however, it does not determine the future price trend.
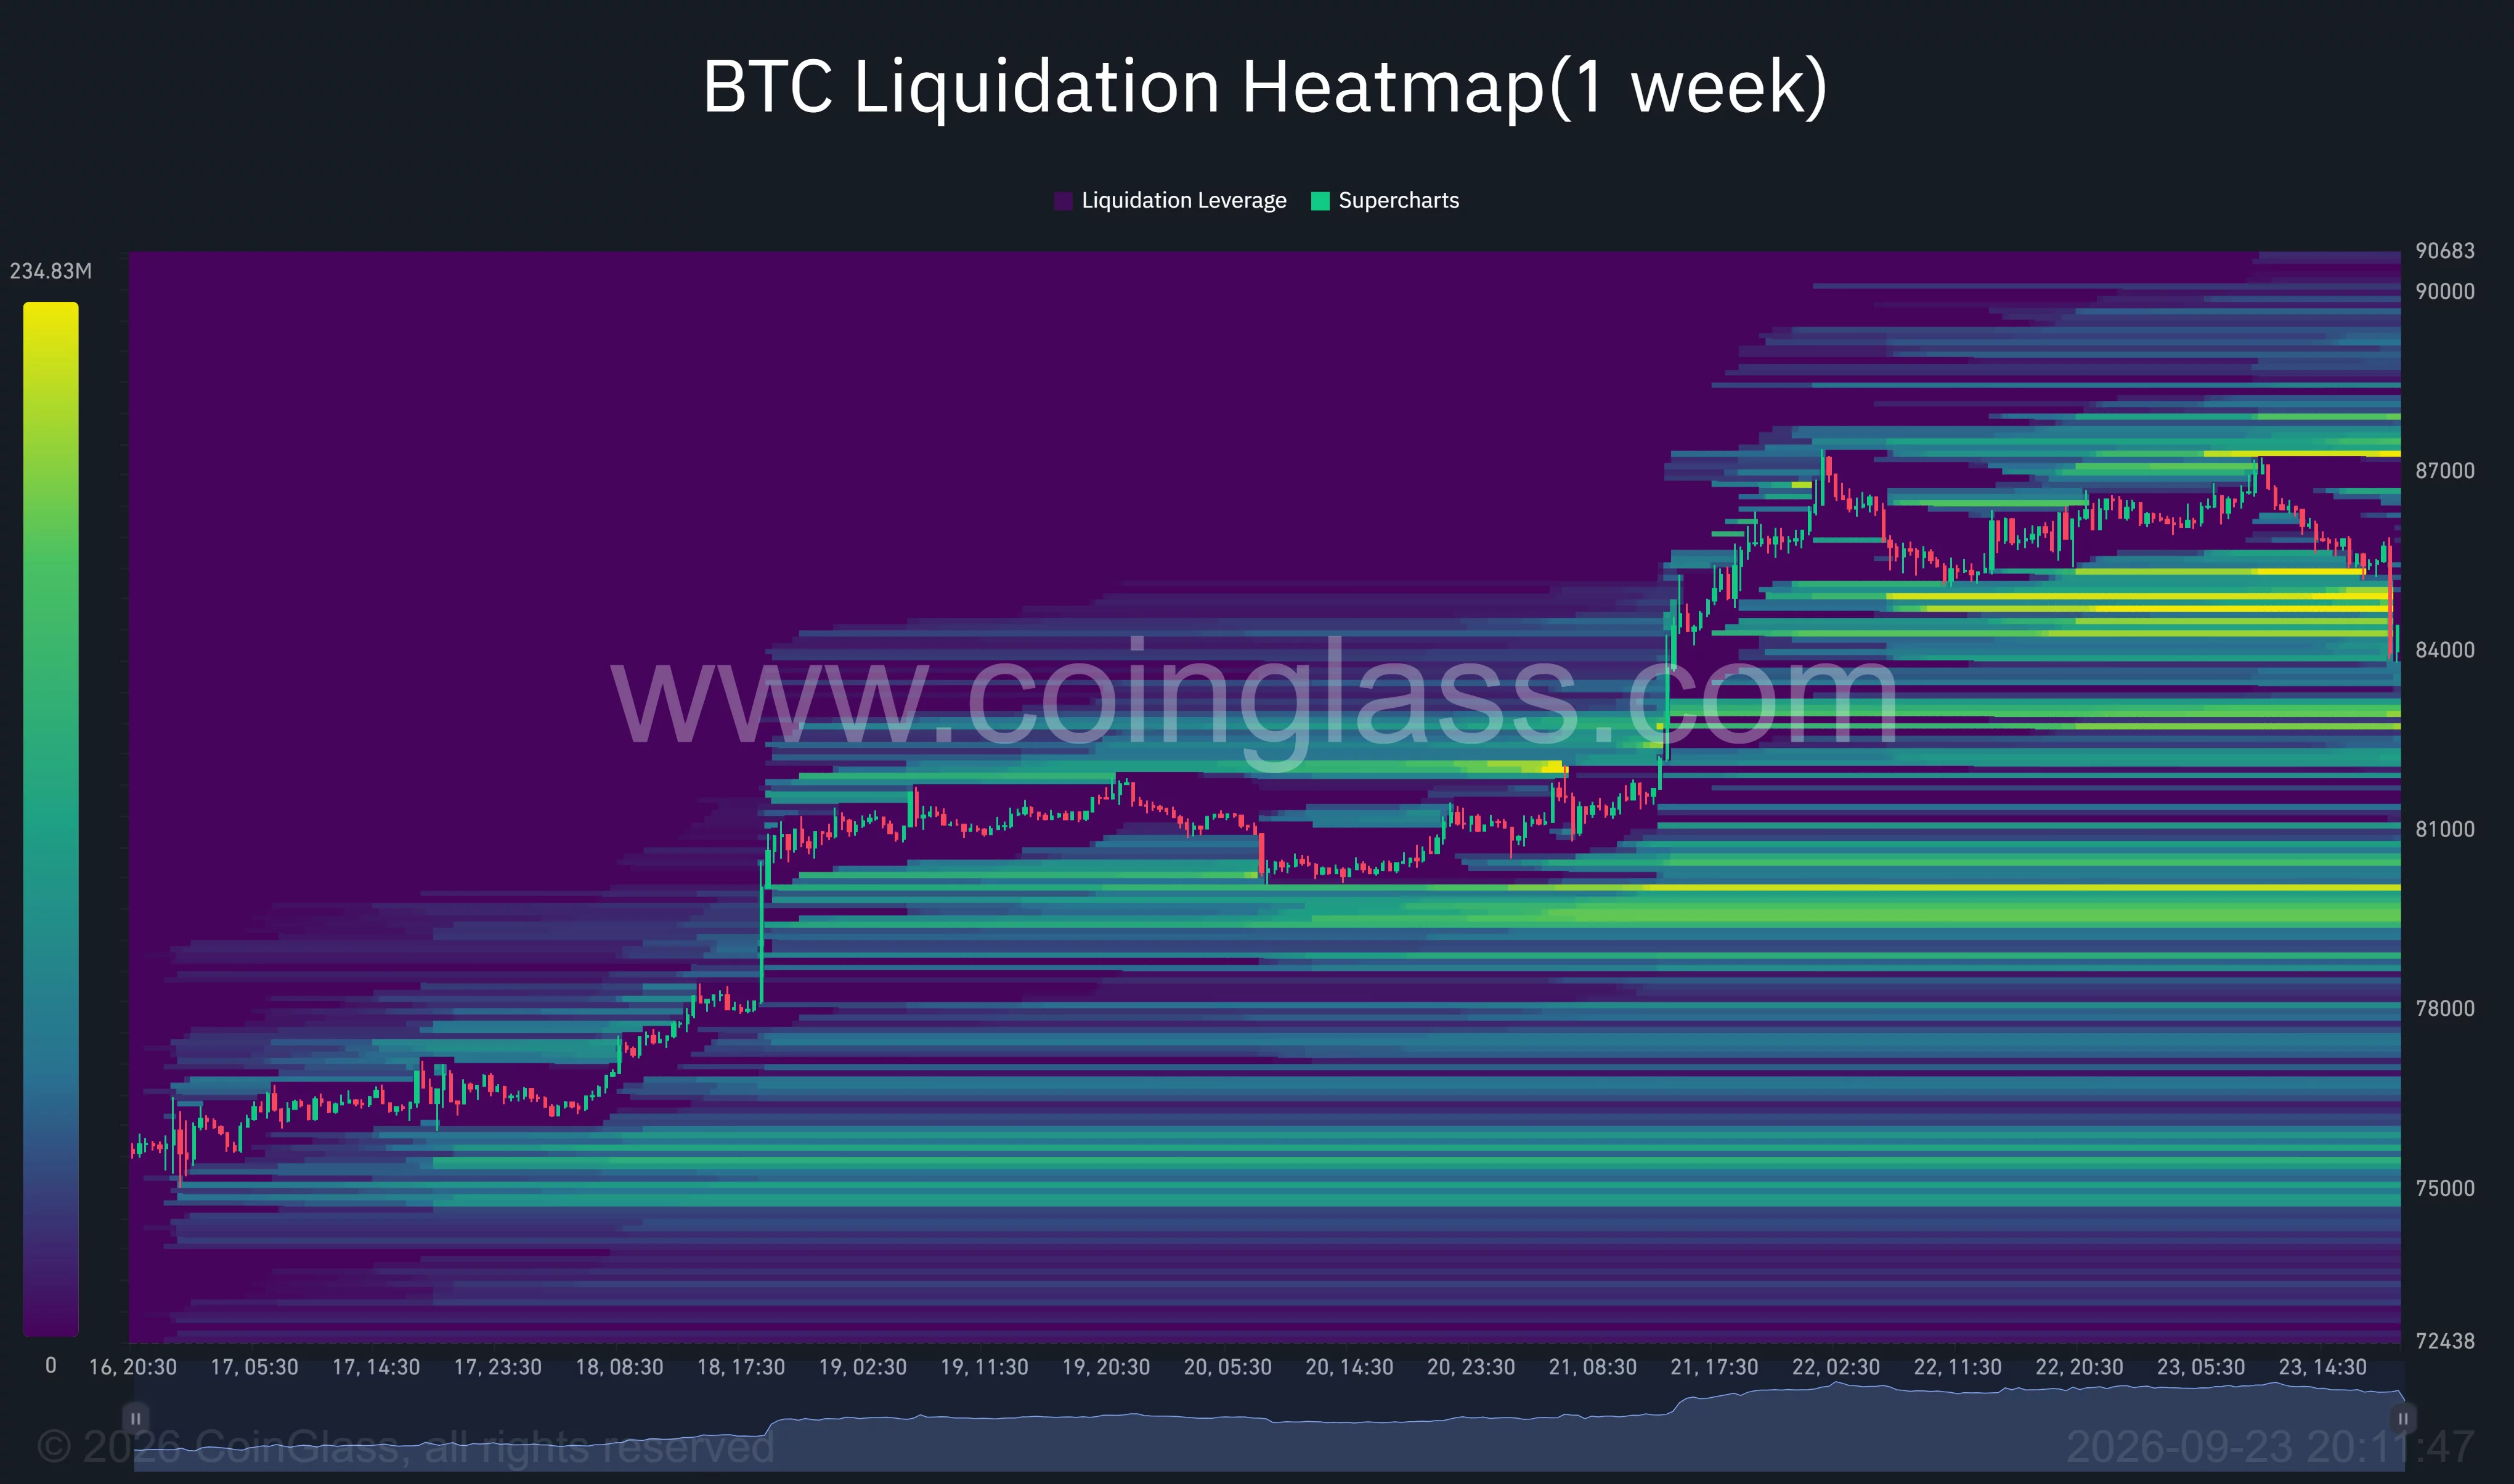
The recent CoinGlass liquidation heatmap reveals considerable concentrations of liquidity around the $84,500 to $85,000 range, as well as between $82,500 and $83,000, with another band near $87,000 to $87,500. These areas denote potential liquidation points for leveraged positions rather than solid support or resistance levels.
Bitcoin’s $83,600 support faces short-term examination
The most prominent technical level below the current price is the 4-hour Supertrend line at approximately $83,593. If Bitcoin manages to remain above this line, it will stay in the recent 4-hour upward trend. Conversely, a significant drop below this level would highlight the liquidity zone between $82,500 and $83,000, as indicated by the CoinGlass heatmap.
Analytics expert Ardi observed that Bitcoin has lost the $85,000 support of a 4-hour bullish flag and recognized a new liquidity region between $81,000 and $83,000. The daily chart indicates that the 20-day Bollinger Band midpoint is lower, around $79,528, showcasing the distance Bitcoin has surged above its recent daily average.
To regain momentum, buyers must first reclaim the $85,000 level, followed by the previous high of about $87,279. The CoinGlass heatmap points to estimated liquidity for liquidation around $87,000 to $87,500, which closely coincides with that peak. A sustained breakthrough in this area must occur to confirm if the rally has genuinely regained its momentum.
It is vital to understand that neither the heatmap nor the indicators guarantee movement toward specific levels. They help identify areas where the current pullback may challenge the existing trend and show where leveraged positions are focused.
Varied analyst views on Bitcoin’s durability
Tony Dicarlo, director of institutional propositions at RootstockLabs, informed crypto.news that Bitcoin has reclaimed positions above both the 50-week and 200-week moving averages, reflecting a 29% rise over the past 35 days. He attributed this broader recovery to developments in US policy, macroeconomic factors, and interest in spot Bitcoin ETFs.
Dicarlo highlighted the SEC’s proposal for tokenized securities and progress in the House committee regarding the American Reserve Modernization Act as factors bolstering market confidence. The House Financial Services Committee voted 28–21 on September 16 to move the reserve bill forward, which still requires approval from both chambers to become law.
“Looking ahead, while I’m not claiming the end of winter, much of the bad news appears priced in; a combination of favorable regulatory, legislative, and macro developments is helping Bitcoin move higher.”
Nonetheless, Liu’s short-term perspective is more cautious. Her liquidation data indicates that the source of automatic buying has diminished, even as Dicarlo expects support from policy changes and inflows from funds. The differing conclusions arise from distinct evidence: one focused on the forces driving the rise to $87,000, the other considering what may support Bitcoin after the short squeeze.
US ETF inflows assess spot market demand
On September 21, US-listed spot Bitcoin ETFs reported $999 million in net inflows, according to Farside Investors. This amount reflects demand for the funds on that trading day and should not be interpreted as indicative of flows on September 23 or as definitive proof that buyers will sustain current price levels.
For US investors, upcoming ETF reports will indicate whether demand for these funds persists as Bitcoin trends downward. The immediate price challenge lies at $83,593 on the 4-hour chart. Securing support at this level would maintain the recent upward momentum on that indicator, while a failure to do so would shift focus to the lower liquidity zone.
Disclosure: This article is not intended as investment advice. The content and materials provided on this page are for educational purposes only.


